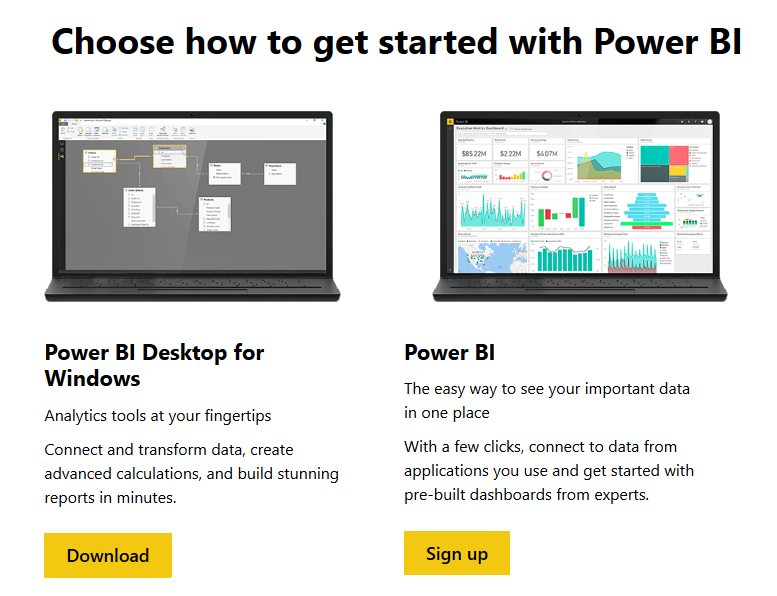
Power BI Desktop puts visual analytics at your fingertips
Power BI
Desktop puts visual analytics at your fingertips with intuitive report
authoring. Drag-and-drop to place content exactly where you want it on
the flexible and fluid canvas. Quickly discover patterns as you explore a
single unified view of linked, interactive visualizations.


Power BI - Overview and Learning

The new experience is centered on PowerBI.com, an online service where you can quickly create dashboards, share reports, and directly connect to (and incorporate) all the data that’s important to you. The new experience also introduces the Power BI Desktop, a dedicated report authoring tool that enables you to transform data, create powerful reports and visualizations, and easily publish to Power BI. The new experience extends to all your mobile devices, too.
Note: If you were using the previous experience and want to migrate to the new experience, you can download this migration guide to understand and prepare for the migration process.
The following sections provide an overview of the new experience, along with introductions and links to learn more about the details and capabilities of each offering.
Power BI - the new experience
In the new experience, you create dashboards that keep you informed about what’s most important about your business. Just like a dashboard in your car displays important information about your vehicle, such as its speed, its fuel level, or how healthy the engine is, dashboard in Power BI display important information about your business.
 In Power BI, dashboards display tiles
that represent important information about your business. Tiles are
based on reports (just like gauges are based on vehicle data from the
engine, the fuel tank, or the battery). You can select a tile to explore
more information from the underlying report.
In Power BI, dashboards display tiles
that represent important information about your business. Tiles are
based on reports (just like gauges are based on vehicle data from the
engine, the fuel tank, or the battery). You can select a tile to explore
more information from the underlying report.  The new experience also introduces a dedicated report authoring tool:
With Power BI Desktop, you get a powerful and dedicated report authoring tool that enables you to connect to and combine data from lots of different sources, using Power BI Desktop's Query Editor. From the datasets you build with Query Editor you can create rich reports and visualization within Power BI Desktop. And when you’re done, publishing to the Power BI service is easy.
 There’s a lot more to learn about the new experience, and
plenty of content to help you . The following links provide information
about the new experience, and start with overview information (to get
your familiar, oriented, and comfortable) then move into specifics. A
separate section is dedicated to the Power BI Desktop, and those links
also go from overview to specifics.
There’s a lot more to learn about the new experience, and
plenty of content to help you . The following links provide information
about the new experience, and start with overview information (to get
your familiar, oriented, and comfortable) then move into specifics. A
separate section is dedicated to the Power BI Desktop, and those links
also go from overview to specifics. Getting Started - the new experience


Publish to Power BI from Excel 2016
Before we go any further, there are few things to keep in mind:
-
Before you can publish to Power BI, your workbook must be saved to OneDrive for Business.
-
The account you use to sign in to Office, OneDrive for Business, and Power BI must be the same account.
-
You cannot publish an empty workbook or a workbook that doesn’t have any Power BI supported content.
-
You cannot publish encrypted or password protected workbooks, or workbooks with Information Protection Management.
-
Publishing to Power BI requires modern authentication be enabled (default). If disabled, the Publish option is not available from the File menu.
To publish your Excel workbook
In Excel, click File > Publish.If your workbook isn’t already saved to OneDrive, you’ll need to save it there first. Click Save to Cloud and choose a location in OneDrive for Business.
 Once your workbook is saved to OneDrive, when you click Publish, you’ll get two options on how to get your workbook into Power BI.
Upload your workbook to Power BI
When you choose this option, your workbook will appear in Power BI just like it would in Excel Online. But, unlike Excel Online, you’ll have some great features to help you pin elements from your worksheets to dashboards.You can’t edit your workbook in when open in Power BI, but if you need to make some changes, you can click Edit, and then choose to edit your workbook in Excel Online or open it in Excel on your computer. Any changes you make are saved to the workbook on OneDrive.
When you upload, no dataset is created in Power BI. Your workbook will appear in Reports, in your workspace navigation pane. Workbooks uploaded to Power BI have a special Excel icon, identifying them as Excel workbooks that have been uploaded.
Choose this option if you only have data in worksheets, or you have PivotTables and Charts you want to see in Power BI.
Using Upload from Publish to Power BI in Excel is pretty much the same as using Get Data > File > OneDrive for Business >Connect, Manage and View Excel in Power BI from Power BI in your browser.
Export workbook data to Power BI
When you choose this option, any supported data in tables and/or a data model are exported into a new dataset in Power BI. If you have any Power View sheets, those will be re-created in Power BI as reports.You can continue editing your workbook. When your changes are saved, they’ll be synchronized with the dataset in Power BI, usually within about an hour. If you need more immediate gratification, you can just click Publish again, and your changes are exported right then and there. Any visualizations you have in reports and dashboards will be updated, too.
Choose this option if you’ve used Get & Transform data or Power Pivot to load data into a data model, or if your workbook has Power View sheets with visualizations you want to see in Power BI.
Using Export from Publish to Power BI in Excel is pretty much the same as using Get Data > File > OneDrive for Business >Export Excel data into Power BI from Power BI in your browser.
Publishing
When you choose either option, Excel will sign in to Power BI with your current account, and then publish your workbook to your Power BI site. Keep an eye on the status bar in Excel. It shows how things are going. When complete, you can go to Power BI right from Excel.


Comments
Post a Comment